
plot01.m - Simple Plot
Contents
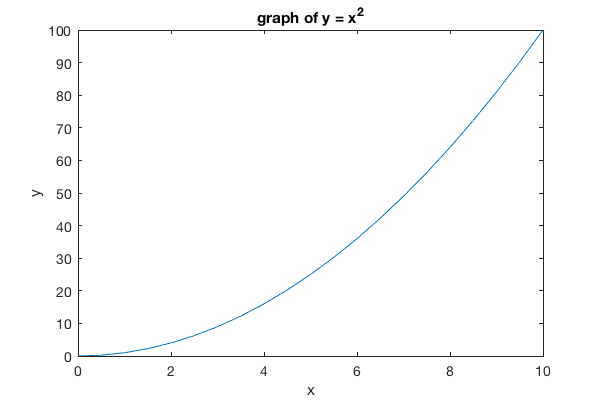
Plotting y = x^2
To plot y = x^2, we follow these steps:
- First create an array of x values. We choose plot the function on interval [0,10] with data points spaced every 0.5.
- Next, square each element in the x array and store it in a new array y
- We use the plot command and label the axes
Here's the code:
x = 0:0.5:10;   % x values range from 0 to 10 in steps of 0.5
y = x.^2;       % square each element in x array and store in y

plot(x,y)       % plot y vs. x (defaults as blue line connecting points)

xlabel('x')     % label horizontal axis
ylabel('y')   % label vertical axis
title('Graph of y = x^2')    % title
And here's the plot:
Plot Styles and Color Options
Matlab offers a simple method of creating plots with different line and marker styles and colors. Here's a list of the basic options:
Color Options:
'r' = red
'g' = green
'b' = blue
'y' = yellow
'c' = cyan
'm' = magenta
'k' = black
'w' = white
Line Options:
'-' = solid line
':' = dotted line
'--' = dashed line
'-.' = dash-dot line
Marker Options:
'o' = circle
'+' = plus
's' = square
'*' = star
'^' = up triangle (carrot = shift-6)
'v' = down triangle (lowercase v)
'x' = x
'd' = diamond
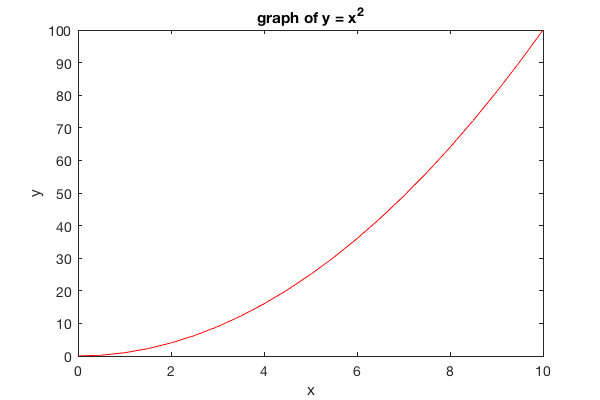
Example: Red Line
To make the blue line in the previous example red, replace the plot command in the previous example with the command:
plot(x,y,'r-')
the dash '-' says to connect the points together with a solid line and the 'r' says to color the line red. Here's the result:
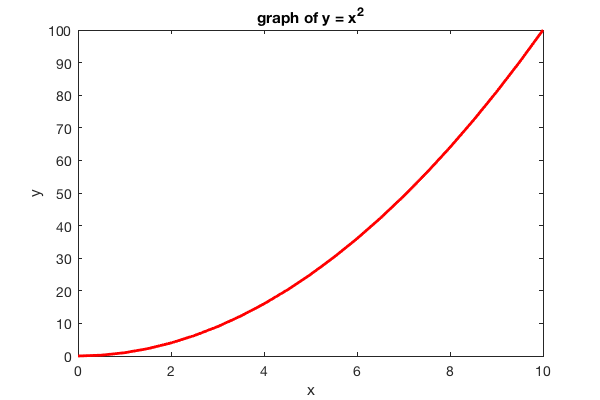
Example: Thick Red Line
To change the thickness of the line use the 'LineWidth' option like this:
plot(x,y,'r-','LineWidth', 2)
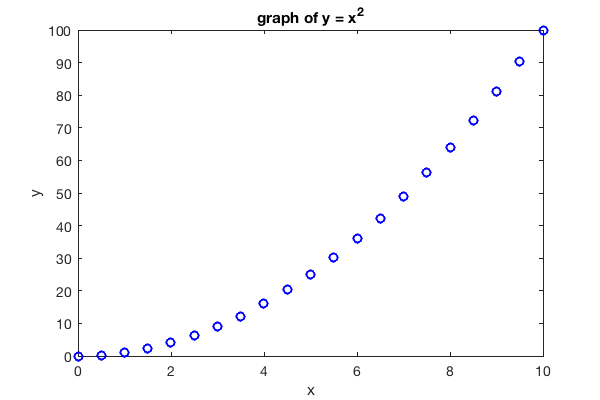
Example: Blue Circles
To plot blue circles at each point use the following command:
plot(x,y,'bo')
the 'o' symbol says to draw a circle at each data point. Here's the result:
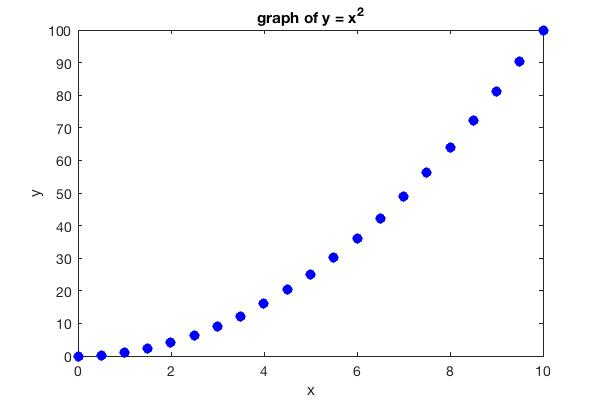
Example: Filled Blue Circles
To draw draw filled markers use the 'MarkerFaceColor' option like this:
plot(x,y,'bo','MarkerFaceColor','b')
In principle, you can use a different color to fill in the marker than you use to draw the marker, but this is generally not desireable.
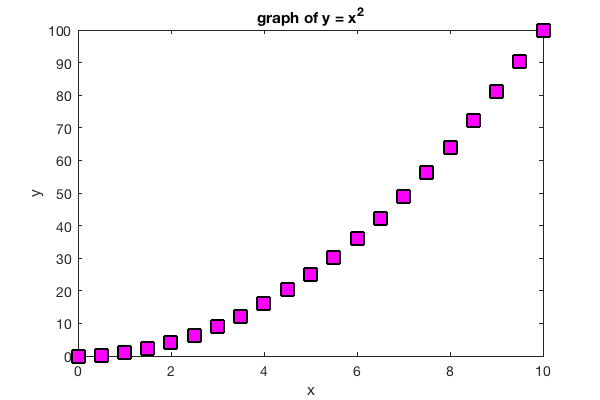
Example: Big Magenta Squares
In this example we draw black squares with the 'ks' option and then fill them in with magenta using 'MarkerFaceColor'. We use 'MarkerSize' to adjust the saze and make them big.
plot(x,y,'ks','MarkerFaceColor','m','MarkerSize',12)
Custom Colors
We can create custom colors by specifying their RGB (red, blue, green) values in a 1x3 matrix like this:
c = [R G B];
where R, G and B are values between 0 and 1. If all three values are 1, then white is produced. If all three are zero then it gives black. Here's a list of RGB values around a color wheel:
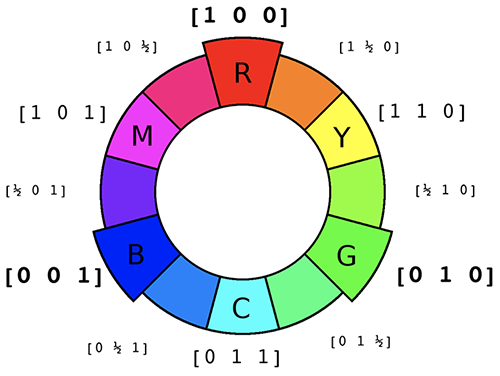
The following example uses dark green, filled circle markers:
plot(x,y,'o','Color',[0 1/2 0], 'MarkerFaceColor', [0 1/2 0])
